


Adresse
1 rue de Saint-Petersbourg75008 Paris
Mail
contact@bam.techTéléphone
+33 (0)1 53 24 00 83The goal of this article will be optimizing the startup time of an Android app, using Android Studio monitoring and performance tools belt.
We are going to optimize the startup time of a “lighter” version of the Jetsnack application (part of apps samples from Google https://github.com/android/compose-samples). In this version, only the app’s 5 carousels are kept in the Home screen.
I choose to limit the complexity in order to simplify performance diagnostics and the corresponding optimisation. Practically, the fix consisted in applying an “above the fold” drawing strategy.
Benefits are :
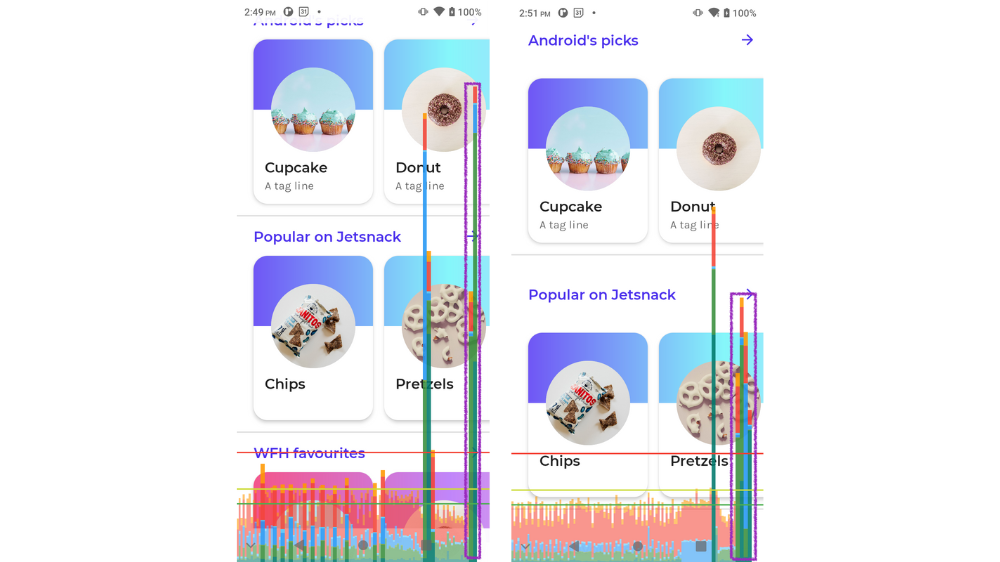
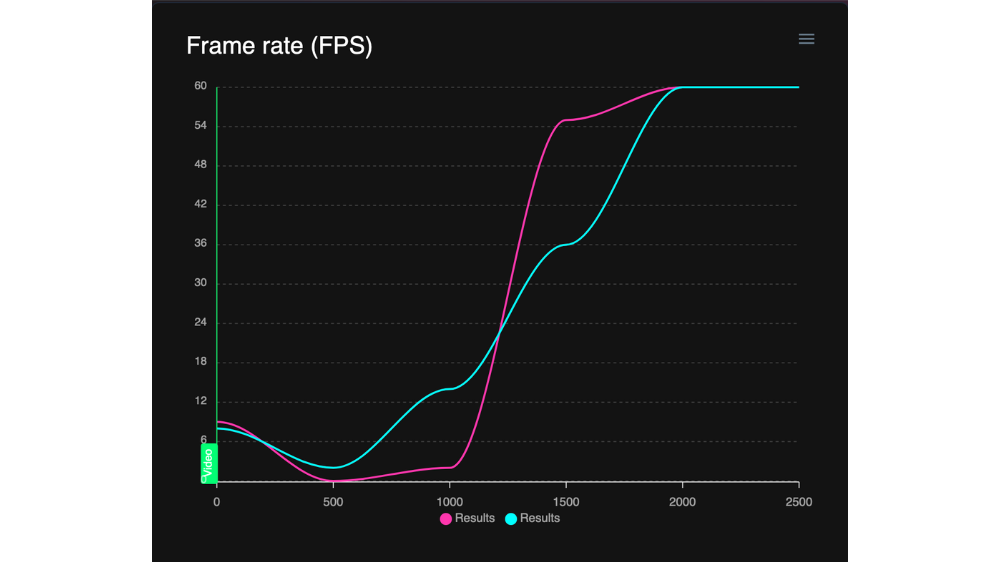
As a teasing, here is the result, before and after (timelapse is almost one second) :
.gif)
This may seems a small improvement but keep in mind that those 5 carousels are solely a piece of the Jetsnack app, which, when full, looks like this
.png)
We have to be sure that our fix didn’t introduce unwanted behavior, so we will follow a structured & cohesive approach for profiling & optimization 😎
During the last Google IO, Ben Trengrove presented a cohesive mindset that allows us to stay on track in our debugging & optimizing journey. This process has 4 steps:

We are going to tackle them, one by one 😉
That’s been said, let’s optimize !
A great tool to quickly identify performance issues is the GPU profiler. To activate it, go to Settings > System > Advanced > Developer options > Monitoring > Profile HWUI rendering > On screen as bars.
On application startup, the GPU profiler data might be polluted by Android OS processes. As we would like to inspect the Home screen, navigating from SnackDetail screen to the Home screen will do the job

Quoting the doc :
Each vertical bar along the horizontal axis represents a frame, and the height of each vertical bar represents the amount of time the frame took to render (in milliseconds). The horizontal green line represents 16.67 milliseconds.
If a frame’s computation is completed in more than 16 ms, the corresponding bar is opaque and overflow the horizontal green line = it’s an FPS overflow.
What about the colors ? The doc states that “Each bar has colored components that map to a stage in the rendering pipeline”. Here is a legend of those colors :
.png)
Let’s detail the highest two bars (surrounded in yellow).
.png)
Those two frames clearly blow out the green horizontal threshold, as they take way more than 16 ms to compute.
Into those frames, the highest bars segments are the “number 2 green” ones. It corresponds to the “Input Handling & Animation” rendering stage.
I’ve tried to associate it to the corresponding Compose Phase. As a reminder, Compose is made of three phases :
.png)
Asking help to Ben Trengrove, I got the following answer:
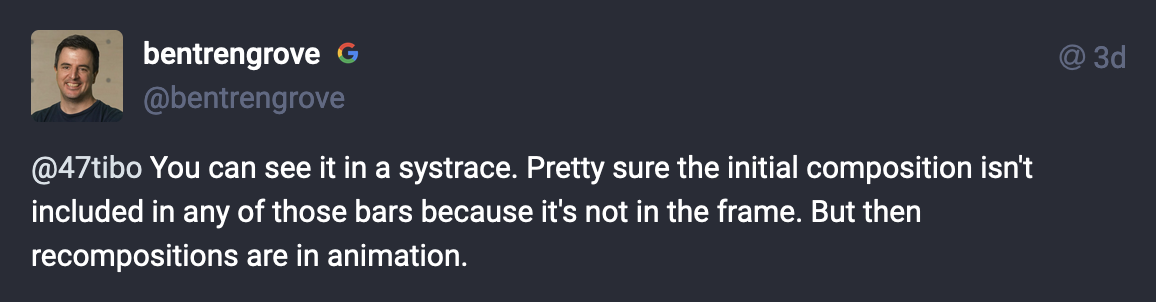
Thus, appart from the initial composition, the “Animation rendering stage” corresponds to Compose “Composition phase”!
.png)
The definition of our performance issue can be : “Expensive composition processes in the Home screen leads to FPS overflow, that is, a longer startup time.”
We want to be 100% sure that our hypothesis is “real” and not context driven.
At BAM we have developed a tool that perfectly address this concern, Flashlight !
Quoting the Flashlight team:
Performance measures are usually not deterministic, the best way to combat this is to:
- run several iterations and average results
- automate user behavior
Let’s use Flashlight to automate app startup and profiling :
This gives us a nice report, that we can visualize:
Flashlight confirms our hypothesis, that is : a total drop of the FPS rate during the first second of the application startup, which is so critical !! Another interesting fact is that the CPU reach a peak usage during this very same period, indicating that it has too much instructions to handle.
And what are those instructions ? Compose’s Composition processes of course 😎
To understand this issue, let’s switch back to Android Studio and two awesome tools : Recomposition Highlight and System Trace for Composition.
Note : For Recomposition Highlight you’ll have to switch back to a ++code>debug++/code> build :
.png)
This tool only works when application in foreground, so we won’t be able to inspect app startup. So, same for the GPU Profiler, let’s inspect while navigating from SnackDetail screen to the Home screen:
We can see that all the “snacks” carousels are recomposed simultaneously, which explains the huge Composition workload 🙂.
Note : don’t forget to switch back to a ++code>release++/code> build !
Apart from the visual check we can have a look to the Profiler System Trace, focusing on the composition processes. Indeed, Android Studio now supports composable functions in a system trace (defined by a low overhead).
To activate it, add the runtime-tracing dependency to your app ++code>gradle++/code> file:
Let’s start a first recording session and, again, navigate from SnackDetail to Home screen.
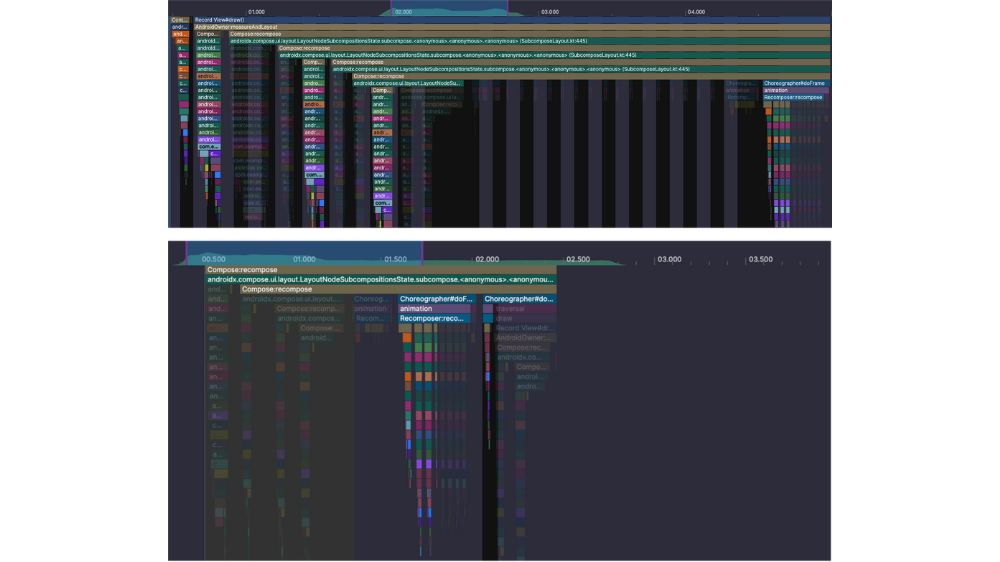
The following GIF shows how I used the tool, making a 1.03 seconds timeline selection of the recorded system trace. The video also emphasis all the relevant informations.
.gif)
On the picture bellow, I’ve highlighted the main points of interest:
.png)
Now, if we want to go deeper in our analysis, we have to go down the Composition hierarchy from top (parent composable) to down (child composable), starting at LayoutNodeSubcompositionState.subcompose.
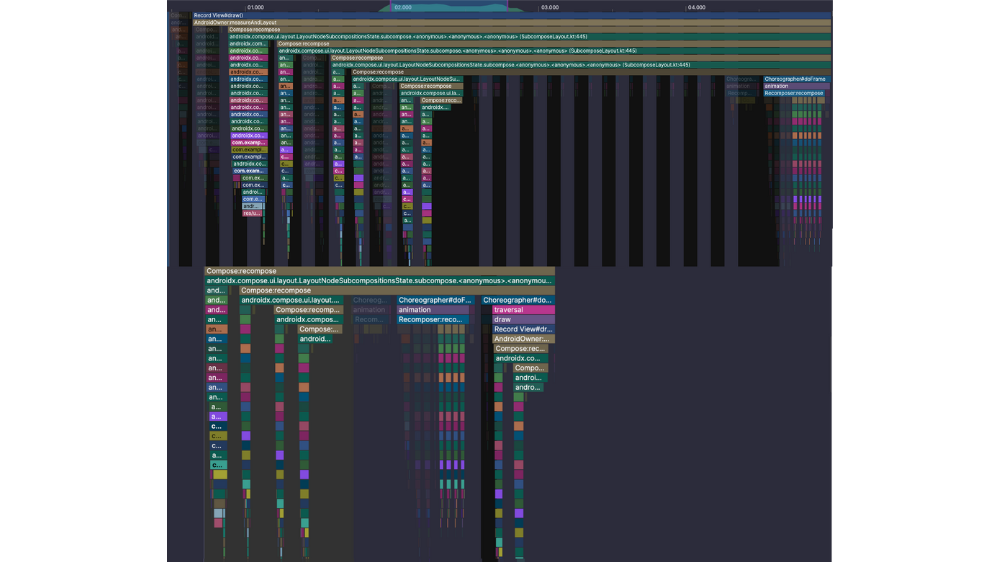
In the picture bellow, I’ve highlighted two hierarchies:
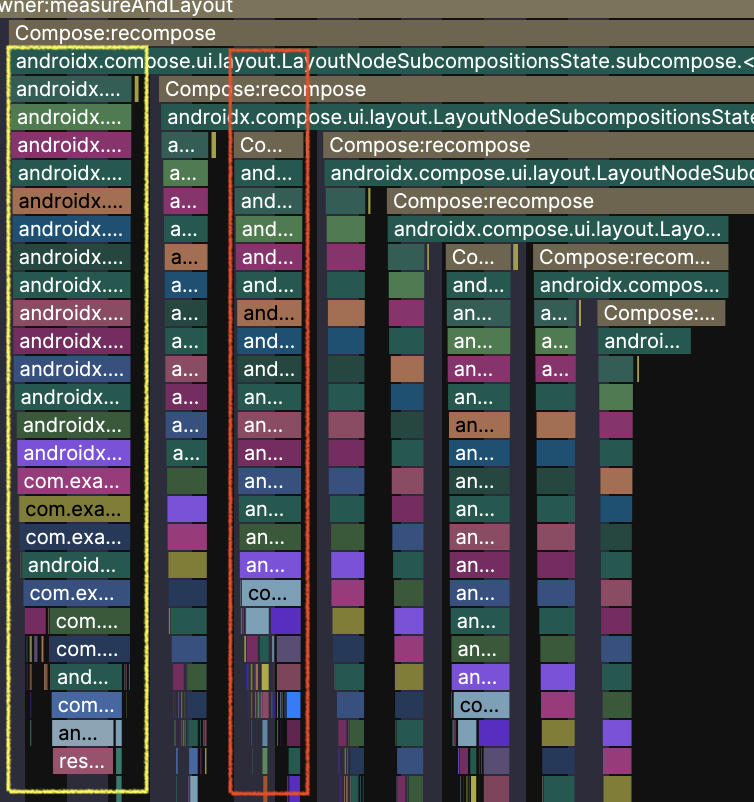
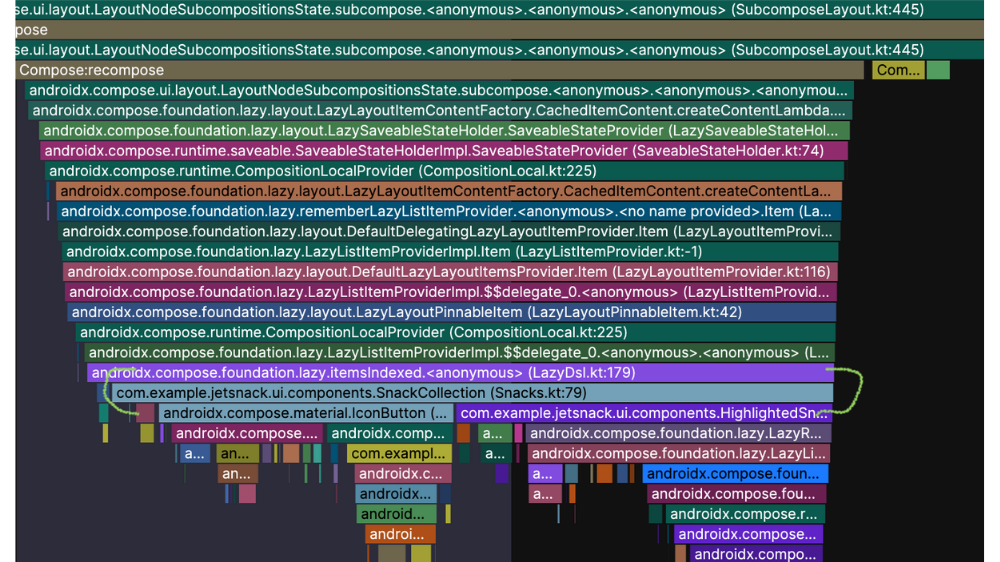
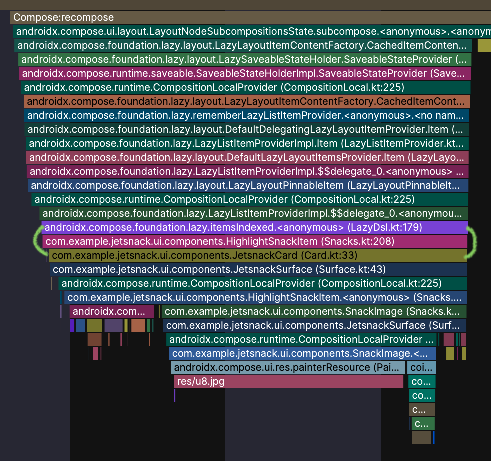
Those stacks can be spotted multiple time in our 1.3 seconds timeframe :
.png)
.png)
It’s worth noting, that, taken independently, neither ++code>HighlightSnackItem++/code> , nor ++code>SnackCollection++/code> composable functions’ stacks takes too much time to execute !
The real “problem” is that all those stacks are called from the very same LayoutNodeSubcompositionState.subcompose root process…
Bellow is a screenshot presenting the position of the corresponding composables in the screen (++code>SnackCollection++/code> bordered in red, ++code>HighlightSnackItem++/code> bordered in yellow):
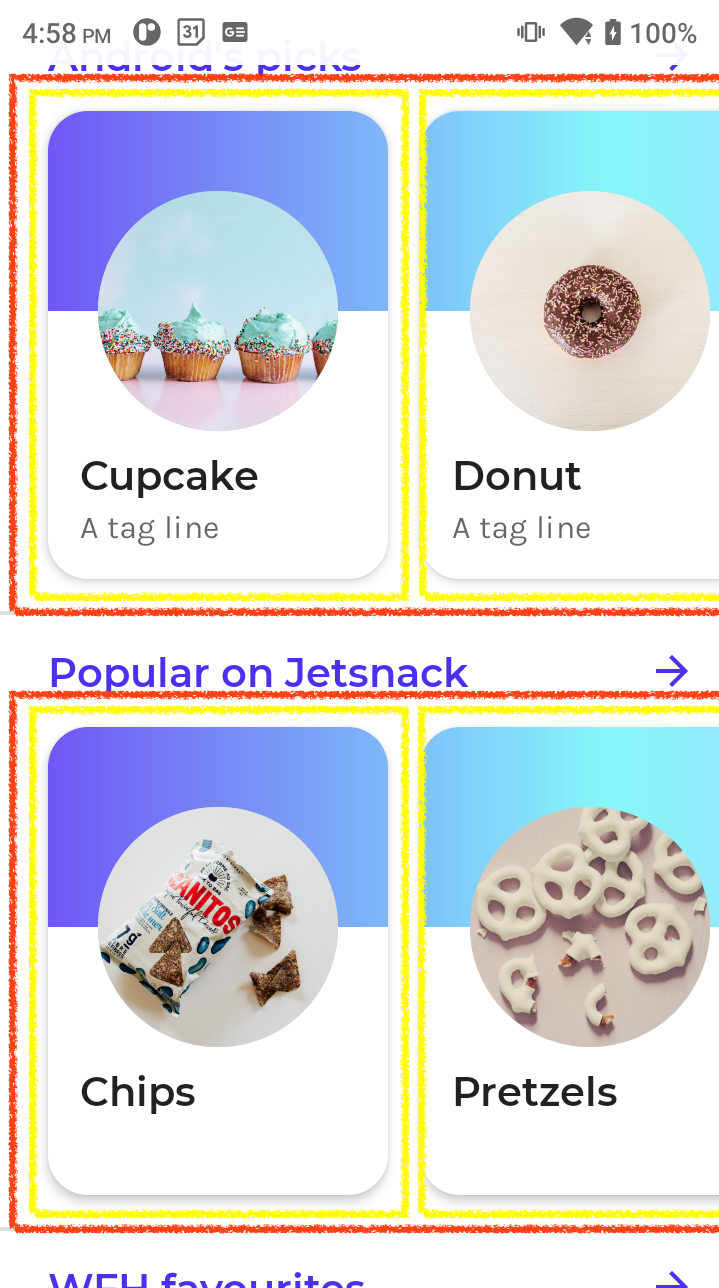
Our analysis tells us that the performance issue is due to this massive LayoutNodeSubcompositionState.subcompose call.
So, why don’t we alleviate its workload by instructing Android to “spread out” the composition of those ++code>HighlightSnackItem++/code> and ++code>SnackCollection++/code> over time?
From a developer point of view, it consists in deferring composition with a ++code>LaunchedEffect++/code> 🚀
After lots of tests and trials, on various composables (including the initial ones), I’ve identified the best deferring strategy : it consists in delaying the composition of carousels that are not visible when application starts, ie, carousels that are “bellow the fold”.
This technique is well known in web development, with the use of the ++code>content-visibility++/code> CSS property (see this great article from LogRocket)
Back to the codebase, carousels are represented by the ++code>HighlightedSnacks++/code> function composable (called from ++code>SnackCollection++/code> , in file ++code>Snacks.kt++/code>).
Only 2 carousels are above the fold when the app starts, so let’s delay composition of carousels whose indexes are > 1 (500 ms delay is empirical):
As simple as that 😎
Let’s rollout our tests tools again and check the improvements !
Instead of two long frames, we now have 4 shorter frames (still, above the 16 ms threshold). The segments associated to the Composition phase are now really smaller ✅
With Flashlight we can compare two reports, one onto another:
Legend :
Before the fix, the FPS rate was crushed during the first second. Above the fold strategy now allows FPS rate to increase linearly as soon as app starts ✅
We managed to regroup all compositions functions stacks in the first half of our timeframe, dividing by 2 the duration of the LayoutNodeSubcompositionState.subcompose root process (= 700 ms) ! ✅
I hope this article gave you a good overview of the possibilities offered by Android Studio’s optimization tools. Associated with the powerful BAM Flashlight report utility, it makes a quite flexible tools suite to “Define, Reproduce, Validate & Fix” tricky performances issues.
I’d love to have comments and feedbacks, so don’t hesitate to contact me on this topic. 🙂


Le BAM Innovation Lab, pour rester à la pointe des dernières innovations tech et produit !


