


Adresse
1 rue de Saint-Petersbourg75008 Paris
Mail
contact@bam.techTéléphone
+33 (0)1 53 24 00 83Xcode is a requirement when you want to program for an iOS device. Like all IDE (integrated development environment, it is the software that allows you to program), Xcode has a huge number of tools that are sometimes a bit hidden. In this article, I'll try to show you the ones I find the most useful.
Before we start, just a reminder of how Xcode is organized.
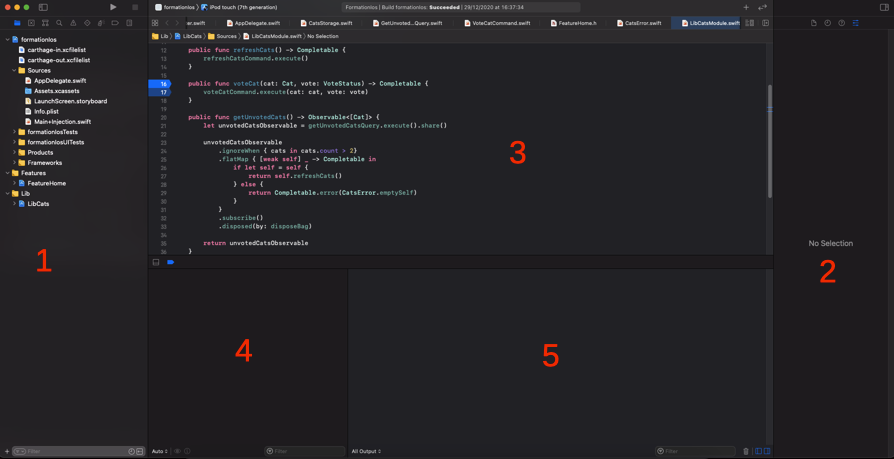
Xcode with everything opened
1. It is the navigation panel. You have different navigators: project, source control, etc.
2. It is the inspector panel. You have different inspectors depending on what you are looking at. When it is code, there is for example the quick help inspector.
3. It is the main area. It is usually your code, but it may be a storyboard, some settings, or a tool you selected.
4. It is the variable view, used when you stopped at a breakpoint
5. It is the console, where the print messages and warnings are shown.
When you want to debug part of your code, a useful tool is the use of breakpoints. It will pause the execution of your program to allow you to inspect elements (including variables' content)
Like most IDEs, you can set breakpoints in Xcode by selecting a line number. If you don't see the line numbers, you can enable this feature in Xcode ? Preferences ? Text Editing ? Display ? Show line numbers.
If you click again on the breakpoint indicator, you can disable it.
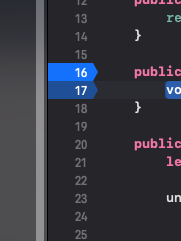
One disabled and one enabled breakpoint
When running your app, you can deactivate all your breakpoints and conserve their state, enabled or disabled. Just below the code area, select the blue arrow.
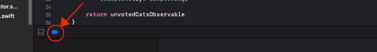
The button to deactivate all your breakpoints
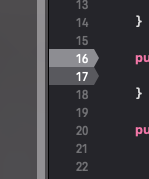
The same breakpoints deactivated
To list all your breakpoints and completely delete one, you can go in the breakpoint navigator, it is the second to last icon in the navigator panel (still the little arrow).
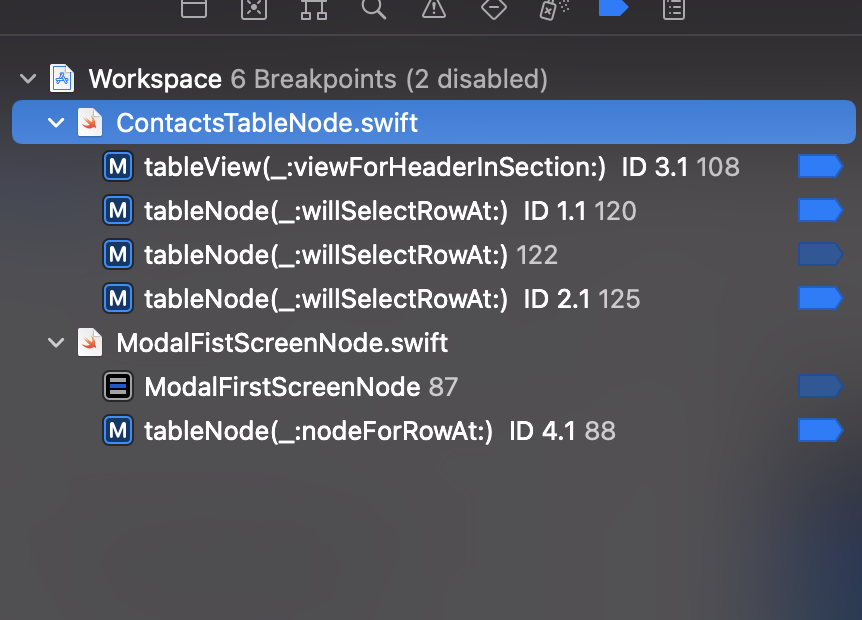
The list of breakpoints
If you program in Swift, you are probably using closures (similar to lambdas in other languages). Sometimes, your line contains both a closure and its surrounding environment. An extreme example can be this
++pre>++code class="has-line-data" data-line-start="19" data-line-end="23">func myFunction(dict: [String:[String]]) {
dict.map { (key, value) in value.map { string in string.trimmingCharacters(in: .whitespaces) }
}
++/code>++/pre>
Here we have 2 closures and a surrounding environment. When building, Xcode expands the breakpoint in 3 sub-breakpoints in the breakpoint navigator. You can now enable or disable the one you want by looking at the closure signature.
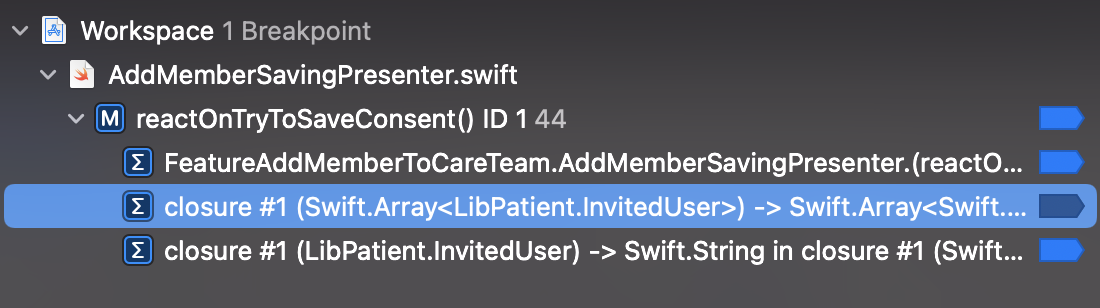
Breakpoint and its sub-breakpoints
When you reach an enabled breakpoint, you can see the content of the variable you have in the scope. But sometimes, especially when it is an inherited object or the variable is computed, you can't easily find what you are looking for. You can instead use the Xcode console and the ++code>po++/code> command. After ++code>po++/code> you can write any code you want, as long as it is valid in the scope, it will be executed and the result prompted.
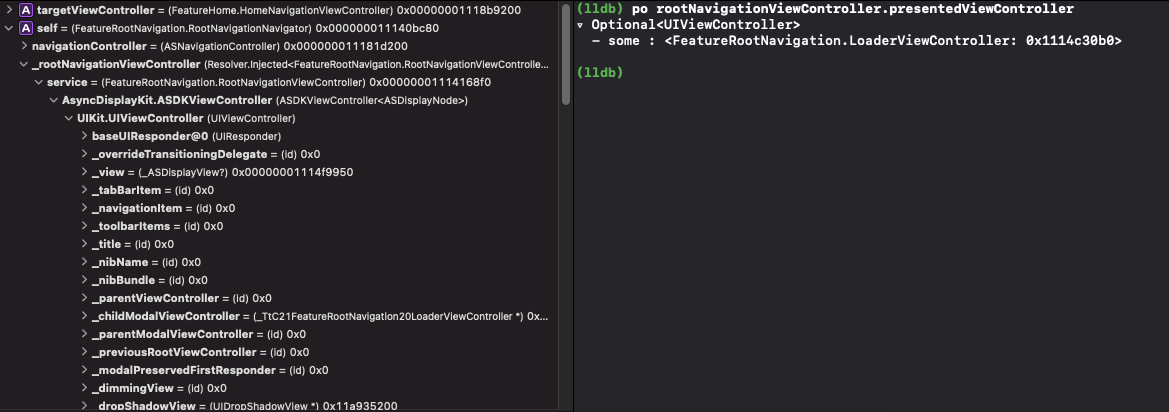
Comparaison between the variable view and the ++code>po++/code> command
The best part is that the console has the same Xcode completion tool as the code area!
Demonstration of the autocompletion
Other commands can be used with lldb, you can read this article if you want to know more about it.
If you are using Carthage as a package manager, you may encounter the error ++code>LLDB: Couldn't IRGen expression++/code>. In this case, you need to delete the framework to blame in your Carthage/Build folder and run the Carthage update command with the option ++code>--no-use-binaries++/code>
Sometimes, you may have an unexpected behavior regarding the layout of your view: something not at the right place or not the right size. Xcode has a tool for you to analyze the layout. When running your app (it can be outside of a breakpoint), on the screen you want to verify, click on the "Debug view hierarchy", on the bar between your code and the debugging area.
You can then see a 3D representation of your view with elements overlapping each other.
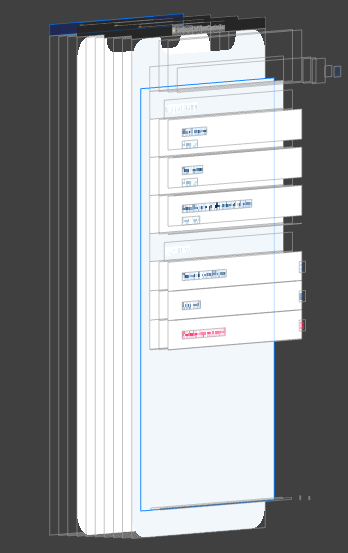
An example of a view hierarchy
You have access to the complete hierarchy on the left navigator. You can also select a specific element, right-click and then "Reveal in Debug Navigator".
If you are using multiple windows, remember to select the right one in the debug navigator.
In the inspector panel, you may also find precise information about the geometry.
Geometry details
You probably noticed that Xcode has a tool to let you track the amount of RAM your app uses (if not, you can find it in the navigator panel, the debug navigator). It can be the first signal if you see the amount increase continuously while using your app.

Debug navigator in action
As you probably already know, in Swift, objects are kept in memory as long as there is one strong reference to them. If you don't use your object and it is still in memory, you probably forgot one strong reference.
To see what keeps an object alive, you can use another tool of Xcode: the memory graph. It is the icon next to the view hierarchy one. In the same way, you can press it whenever you want while running the application. The only condition is that your device (or your simulator) must have a recent version of iOS (at least iOS 13.x when writing this article). It gives you something like this.
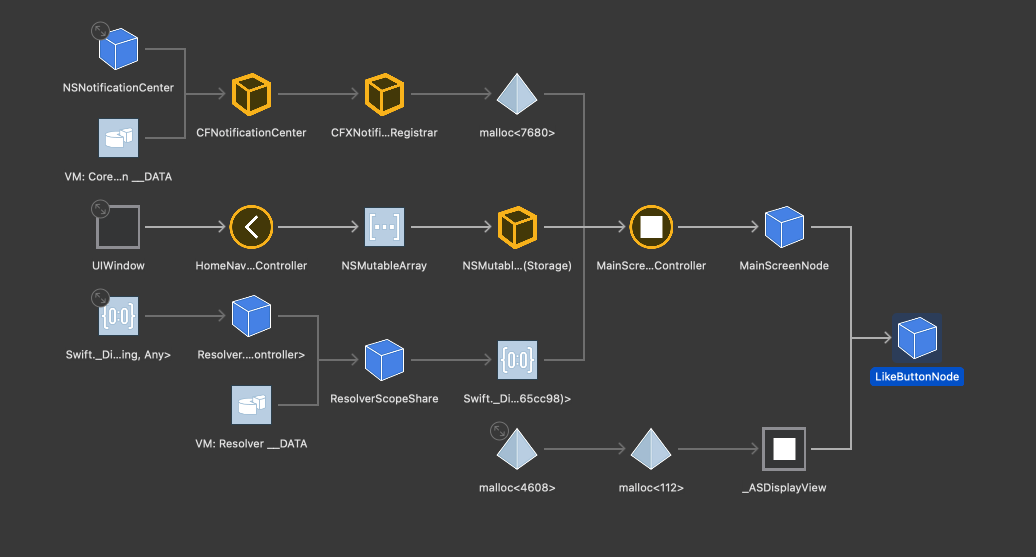
A memory graph
In the left panel, you can select the object you want to observe. In the center, you can see the graph in the object. Your object is the element at the right of the graph. An arrow means "this object has a reference to this one". If the arrow is bold, that means that the reference is a strong one.
Sometimes, this is not enough to fix the memory issue. You need to enable the stack logging. First, select your scheme and click on "Edit Scheme".
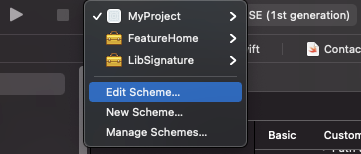
Edit scheme button
Select "Run" on the left panel, then "Diagnostics". You must now select the line "Malloc Stack Logging" as shown below.
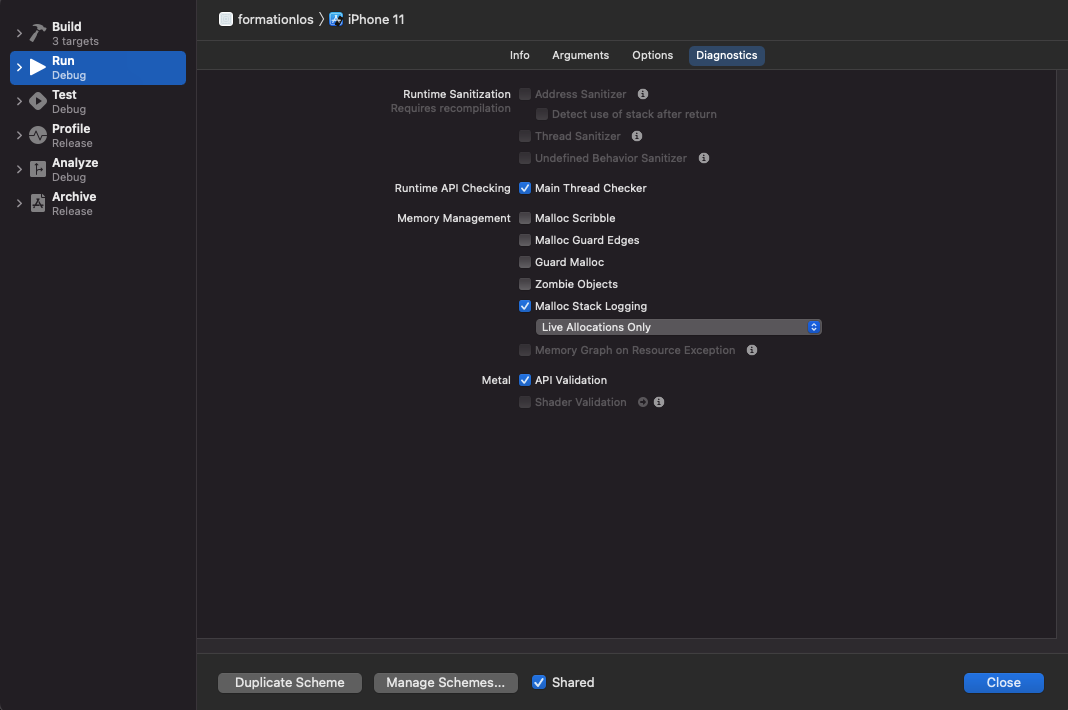
Diagnostic tab
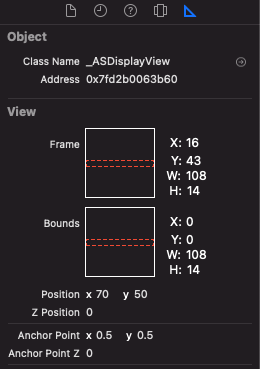
Restart your app with this new setting. You can then open the inspector panel, go to the memory inspector. It will load a precise backtrace of where your object is kept alive. You can even click on the lines to see the precise piece of code.
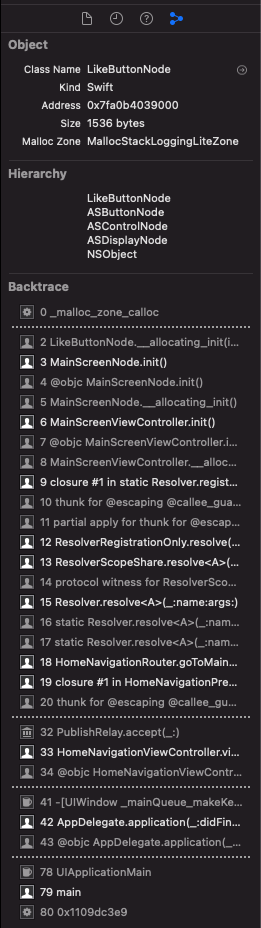
The memory inspector and its backtrace
Like most IDE, Xcode offers you a feature to rename your variables, enums, or objects. To do so, just right-click on something you want to rename, then refactor and rename. You will have a nice transition to see all occurrences that will be refactored.
A nice transition to see all impacted files
If you are modifying a class name that is also the name of the file, it will also affect it!
Just a warning, if you do multiple renames (including file names), this tool may stop working and it will prompt you an error. In this case, you just need to restart Xcode, and will work again, just as before.
When you start your project, you have only one scheme to build one application. But you probably want to have multiple environments with a different bundle id and configuration. For example, we have 4 environments for our application: development, staging, preproduction, and production.
The first step is to select your project file in the left project navigator. Then go in info. Here, you can create as many environments as you want, make sure to duplicate either Debug or Release depending on your needs of debugging tools.
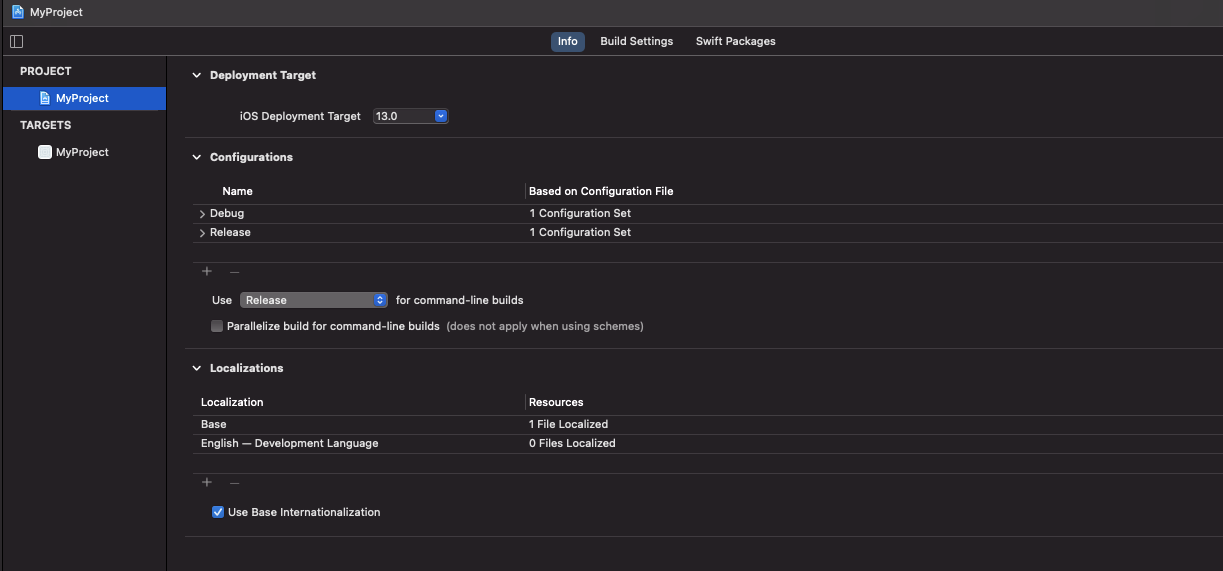
The project's info
Then select your target and go to the "Signing & Capabilities" tab. Here you will be able to give each environment its bundle identifier. Next, go to the "Build Settings" tab. In this area, you will be able to change your app identifier, name, and icon depending on the environment. Search for the resource you want to change and click on the arrow to expand the field.
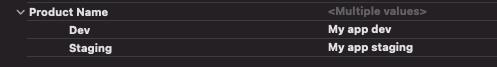
A different product name for each environment
Finally, you need to create a different scheme for each environment. Select your current scheme in the top bar and choose "Edit scheme"
Edit scheme button
Duplicate your project scheme, rename it and choose the corresponding configuration in "Run" ? "Info"

Selection of the configuration of the scheme
Select the scheme you want, select run and you should see a new app installed on your phone or simulator!
But you probably want more than just changing the name of the app. You can have a completely different configuration for each environment. For example, we have a different server URL for development/staging and preproduction/production.
To do something similar, create xcconfig files in your project (I advise you to create one per environment and name them accordingly). Then create a key (the key should be the same in every config file) and a value.
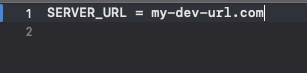
key and value in xcconfig file
Then in your info.plist, add a new entry like this with as a value, the key you chose in the xcconfig files surrounded by ++code>$(++/code> and ++code>)++/code>

Key in info.plist file++code>++/code>
You can now access this value in your code, like this:
++pre>++code class="has-line-data" data-line-start="91" data-line-end="93">Bundle.main.object(forInfoDictionaryKey: "ServerUrl")
++/code>++/pre>
You just need to go back to your project information and select the right configuration file for the right environment.

Project info with the configuration set
Again, you just have to select the right scheme, press run and your selected configuration should be used!
I hope these 6 tips will help you to save some time and debug more effectively. There are plenty of other (more or less hidden) tools, functionalities, and settings in XCode (you can find some more here). Keep exploring and searching and you may find what you search for!


Le BAM Innovation Lab, pour rester à la pointe des dernières innovations tech et produit !


